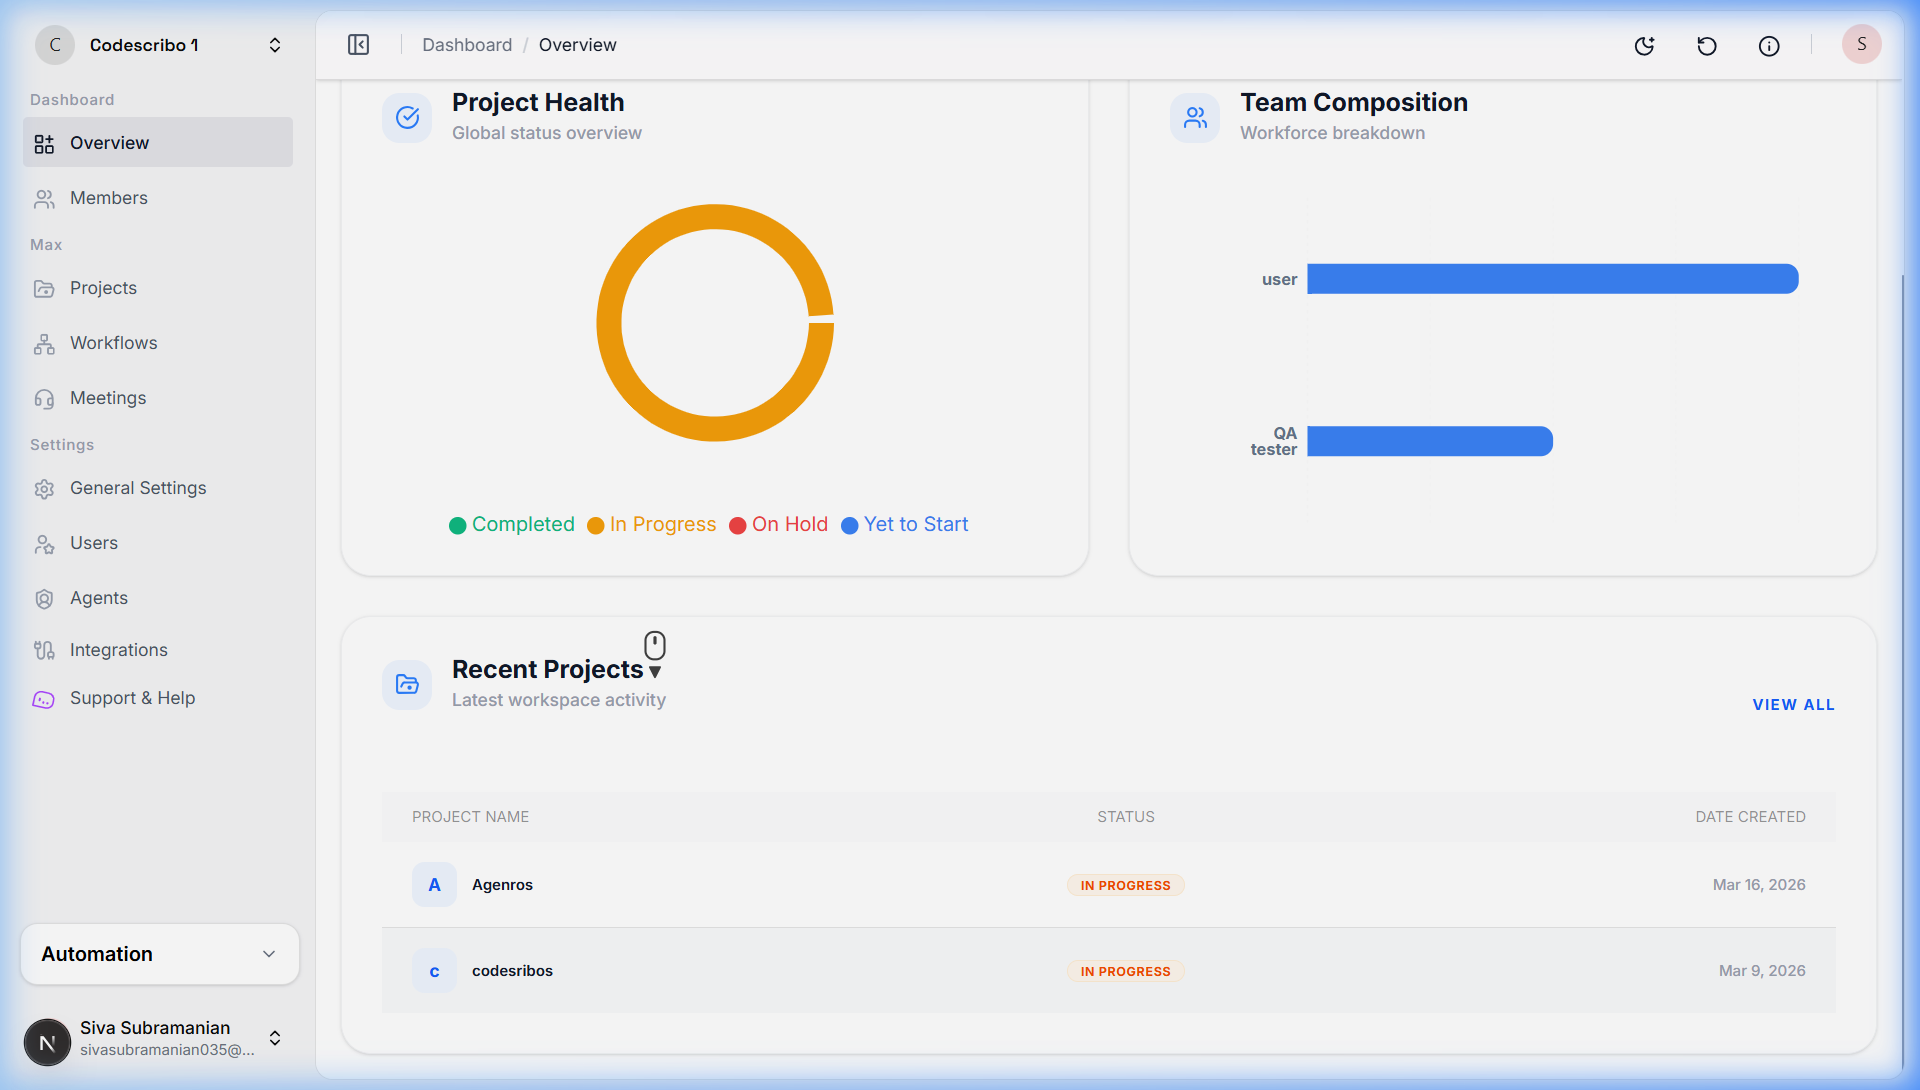
The Overview Page is the main dashboard that provides a high-level summary of system activity, including projects, users, team structure, and recent work. It helps users quickly navigate and monitor overall progress.
3.1 Summary Cards
The Summary Cards section displays real-time counts of essential entities within the system, including Projects, Users, Members, Agents, and Applications. Each card is interactive and redirects users to its respective detailed page, enabling quick navigation. The data is dynamically updated, ensuring that users always see the latest system state.
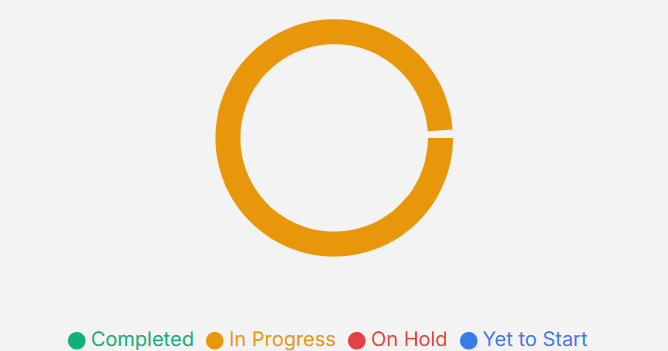
3.2 Project Health Section
The Project Health section provides a visual overview of project statuses using a donut chart. It categorizes projects into Completed, In Progress, On Hold, and Yet to Start, allowing users to quickly understand the overall progress distribution. Hovering over each segment reveals the exact number of projects in that category, enabling fast insights without leaving the dashboard.
3.3 Team Composition Section

Hover Feature
Hover over a team bar to see the exact number of members in that category.
3.4 Recent Projects Section
This list displays the latest projects created or updated within the workspace.
5. Important Notes
Monitoring First
The Overview Page is primarily for monitoring and quick navigation rather than deep configuration.
Deep Hovering
Hover actions are designed to provide granular insights (like ticket counts) without full page reloads.
Activity Tracking
The Recent Projects section acts as a live feed for the latest updates in your workspace.
Status Semantics
Dynamic color-coded status labels give sub-second understanding of project progress.